The Challenger Disaster: Why Data Science Is Important
Thu, 26 Feb, 2026
Read in 6 minutes
VIDEO TRANSCRIPT - What happens when NASA misunderstands data?
Content Advisory
This transcript and video deals contains content which may be upsetting to some people.
The featured video within this transcript contains footage of the fatal explosion of the Challenger space shuttle during a crewed mission. Viewer discretion is advised.
You can view the video here: The Challenger Disaster: Why Data Science Is Important
Corrections and Further Discussion
Additional contextual and factual information has been added to this transcript to improve accuracy. You can jump to the added footnotes[formatted like this] by clicking on them.
Although care has been taken in the writing of this article and the additional context, it is possible that factual errors may still be present. Please contact me if you spot any issues.
Ok, let me tell you a story.
A Problem With O-Rings
It’s 1986, and NASA have a problem with their Challenger Space Shuttle1 - you see, when they planned to launch, it was cold and they had an issue with their. Hold on, let me show you!
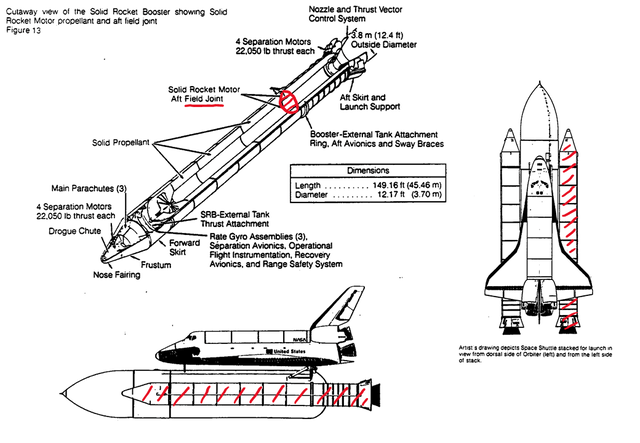
The operating principles of a Space Shuttle are relatively simple; the main Orbiter vehicle is launched by two sets of rocket boosters2, powered by liquid hydrogen and oxygen stored in the famous orange external tank. Two minutes after launch3, the boosters fall away, and the Orbiter is powered by the three rocket engines.
By burning liquid hydrogen in thrusters in a large supply of oxygen, the Space Shuttle achieves the thrust needed for lift off. Now, the O-rings we’re interested in sealed the fuel pipe joints on the shuttle. The hydrogen was burned here (diagrams below) in the Solid Rocket Booster, with the pipe joints located just here (circled section, below) - those were sealed with the O-rings4.
Now, NASA knew that their O-rings became less effective at lower temperatures, with a reduction of elasticity of 5 times between 75 and 30 degrees Fahrenheit - that means that their O-rings were 5 times worse at returning to their original shape. Moreover, the air temperature at launch was 36 degrees Fahrenheit (which is roughly 2 degrees Celsius) - that was 15 degrees colder than any previous launch5. Those were extremely worrying conditions, so they commissioned a graph6.
The Fatal Graph
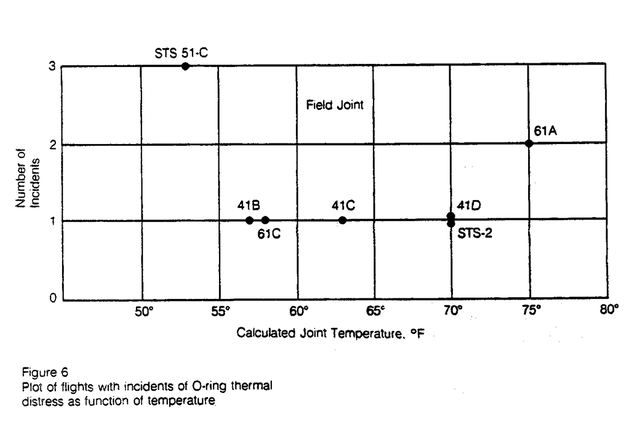
This is the graph that NASA managers were presented with (Figure 6, above)7. Can you find a correlation between the number of incidents and the joint temperature? NASA managers and engineers couldn’t, so they proceeded with the launch.
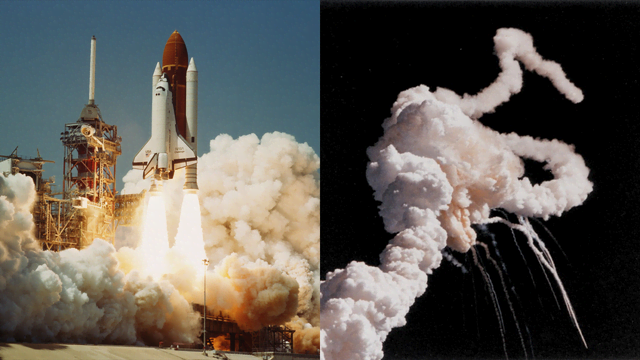
The launch of the Challenger space shuttle began on January 28th, 1986, at 11:38 am with the ignition of the solid rocket boosters. But, 73 seconds into the launch, tragedy struck - the shuttle exploded, killing the entire crew of seven, including scientists and a school teacher.
What Went Wrong?
Let’s re-examine the data, previously we looked at this graph (Figure 6, above) - the same one that NASA managers had been presented with. But, this isn’t the full story. In fact, if we include data from successful launches, we get this graph (Figure 7, below) - notice anything?
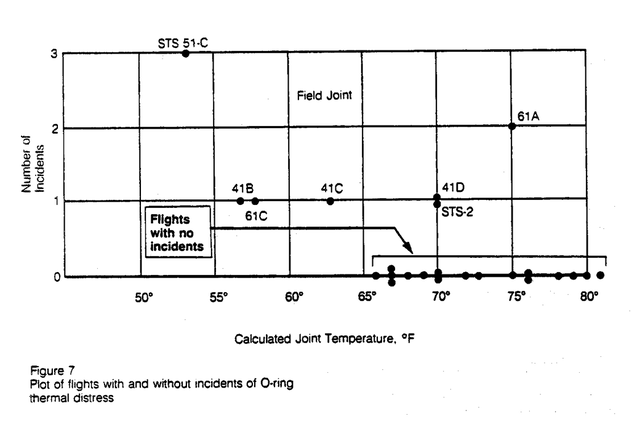
The data that was used did not contain information about launches with zero incidents. With those on this graph, it is a lot clearer that there were no successful launches below 66 degrees Fahrenheit. If this data had been used, the launch would almost certainly have not gone ahead, and lives would have been saved.
All of this is to say that data is incredibly important, whether you’re working at NASA, understanding a medical diagnosis, or even driving. We use data to understand the world, and when we misuse data and are misinformed, mistakes can and do happen.
It has been just over 40 years since the Challenger disaster, and NASA now have more effective protocols and systems in place which aim to prevent future catastrophes8.
Footnotes are included below this section.
Credit to Hannah Fry for the inspiration for this video, and to Royal Holloway, University of London, for filming permission.
Sources
- National Aeronautics and Space Administration (2006). Solid Rocket Boosters and Post-Launch Processing. [online] John F. Kennedy Space Center. National Aeronautics and Space Administration. Available at: www3.nasa.gov/centers/kennedy/pdf/167440main_SRBProcessing06.pdf [Accessed 19 Feb. 2026].
- Ostovar, M. (2025). Challenger STS-51L Accident - NASA. [online] National Aeronautics and Space Administration. Available at: nasa.gov/challenger-sts-51l-accident [Accessed 19 Feb. 2026].
- Rogers, W.P., Armstrong, N.A., Acheson, D.C., Covert, E.E., Feynman, R.P., Hotz, R.B., Kutyna, D.J., Ride, S.K., Rummel, R.W. and Sutter, J.F. (1986). Report of the Presidential Commission on the Space Shuttle Challenger Accident, Volume 1. NASA Technical Reports Server. [online] Available at: ntrs.nasa.gov/citations/19860015255 [Accessed 19 Feb. 2026].
- Wikipedia Contributors (2019). Space Shuttle. [online] Wikipedia. Available at: en.wikipedia.org/wiki/Space_Shuttle [Accessed 19 Feb. 2026].
- Wikipedia Contributors (2021). Space Shuttle Solid Rocket Booster. [online] Wikipedia. Available at: en.wikipedia.org/wiki/Space_Shuttle_Solid_Rocket_Booster [Accessed 19 Feb. 2026].
Read more about how I use Wikipedia.
Image and Video Credit:
- “Space Transportation System Number 6, Orbiter Challenger, lifts off from Pad 39A carrying astronauts Paul J. Weitz, Koral J. Bobko, Donald H. Peterson and Dr. Story Musgrave.” by Unknown, Public domain, via Wikimedia Commons [modified]
- “A photo of the Challenger explosion during STS-51-L on January 28, 2021.Great Images in NASA image GPN-2004-00012.” by NASA, Public domain, via Wikimedia Commons [modified]
- Figures 6, 7, 13, and Space Shuttle diagrams reproduced from the Report to the Presidential Commission [modified]
- “Video of Challenger (STS-51-L) exploding soon after liftoff.” by NASA, Public domain, via Wikimedia Commons
-
We are concerned with mission STS-51-L, the tenth mission of the Space Shuttle Challenger. ↩︎
-
These are technically called Solid Rocket Boosters (SRBs), which were built and supplied by Thiokol. The SRBs were reused throughout the Space Shuttle program, being recovered after each mission to be recommissioned. ↩︎
-
This figure is inconsistently reported; the Report to the Presidential Commission gives this stated value, which is “roughly […] 24 miles down range.” Other literature gives this value as 26.3 nautical miles, 45 km, or 146 000 ft. ↩︎
-
This is a major oversimplification. The O-rings sealed the joints between sections of the motor case, within which liquid hydrogen and oxygen flowed. The joints were packed with putty and installed with two O-rings, which were sealed by the pressure of the liquid fuel within the motor case during launch. This setup forms a tang and clevis joint. The actual O-rings used were 0.25 inches in diameter, a lot smaller than the one I show in the video. These diagrams may be misleadingly annotated, it was the right booster which failed. ↩︎
-
Data from the Report to the Presidential Commission, this transcript is consistent with the original units. 36 °F ≈ 2.22 °C. ↩︎
-
Both Figures 6 and 7 were published in the Report to the Presidential Commission and have been modified from the source for this transcript. ↩︎
-
Most versions of events suggest that neither NASA managers nor engineers were presented with plotted data (including those shown) during the decision making process. In the Report to the Presidential Commission, these graphs (Figures 6 and 7) are illustrative. It is, however, likely that the Thiokol engineers and NASA managers reviewed the data in a similar way to that presented (by considering O-ring distress as a function of temperature without the use of graphs). ↩︎
-
The many reports and reviews commissioned following the STS-51-L disaster outlined the need for changes in both the decision making and commissioning processes used by NASA, which informed internal restructuring and process evaluations. There has only been one fatal incident since 1986 in a NASA spaceflight, which occurred in 2003. ↩︎